The Boston Region MPO (MPO) recently created a Park-and-Ride dashboard to showcase parking use and capacity data at all MBTA stations. Many MBTA stations, which include regional rail and rapid transit, have park-and-ride lots that people traveling to work use every day. Park-and-ride lots can be critical in helping people who do not live within walking distance of a station to access public transit. Since 2000, the MPO has periodically collected parking data, both of personal vehicle and bike, at every parking lot near MBTA stations. This includes those owned by the MBTA, owned privately, and owned by the municipality the station is located in. The data not only helps inform the public about parking information at MBTA stations, but also provides planners and engineers insight on where to invest in transportation infrastructure to support people taking transit.
Parking use near MBTA stations increased by nine percent between 2012–13 and 2017–18
MPO staff found that parking use had increased by nine percent between the 2012–13 and 2017–18 inventories, but was still seven percent lower than peak utilization in 2005–06. Overall use of the park-and-ride lots largely mirror the economy, which suffered major losses in the 2008 economic recession. Between 2005–06 and 2009–10, parking use across MBTA stations dropped 19 percent. Parking use and capacity differed by which mode it connected to.
Utilization at Park-and-Ride Lots near MBTA Stations for All Modes: 2005–06, 2009–10, 2012–13, and 2017–18 Inventories

- For commuter rail, parking use near stations increased by nine percent between 2012–13 and 2017–18 despite more than 3,000 parking spaces being added near stations across the system.
- More parking spaces were added to commuter rail stations than any other mode during this period.
- In the 2017–18 inventory, there was at least one station on every commuter rail line that had 30 percent or more of its parking capacity during the morning peak period.
- For future planning, a major objective should be to communicate the location and availability of less crowded lots to people taking the commuter rail.
Utilization at Park-and-Ride Lots near MBTA Stations for Commuter Rail: 2005–06, 2009–10, 2012–13, and 2017–18 Inventories

- Park-and-ride lots near rapid transit MBTA stations increased by 11 percent, showing an increase in demand, despite increases in parking fees at these lots.
- The number of actual vehicles parked at rapid transit stations were still less than the 2005–06 inventory.
- Parking capacity at rapid transit stations decreased largely due to a parking lot closure near Lechmere in preparation for the Green Line Extension project.
Utilization at Park-and-Ride Lots near MBTA Stations for Rapid Transit: 2005–06, 2009–10, 2012–13, and 2017–18 Inventories

- The commuter ferry has experienced a notable decrease in parking capacity, largely due to the closure of the Quincy Fore River ferry terminal and the conversion of parking spaces near Hull from public to permit-only parking.
- Parking use at ferry stations was at 65 percent in 2017–18, which was 16 percent more than 2012–13.
Utilization at Park-and-Ride Lots near MBTA Stations for Commuter Ferry: 2005–06, 2009–10, 2012–13, and 2017–18 Inventories

Some stations saw significant increases in parking use while a few saw significant decreases
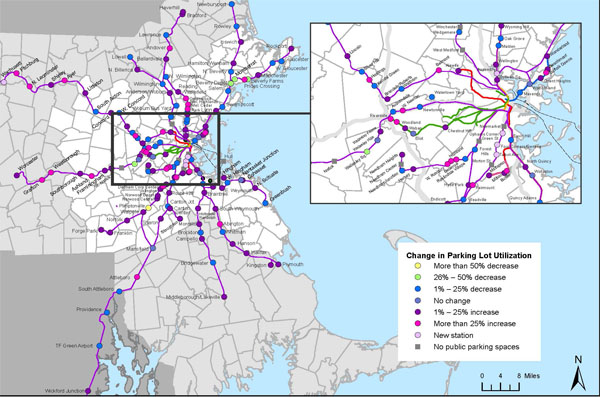
Between the 2012–13 and the 2017–18 inventories, 25 stations experienced a significant increase in use and five stations experienced a significant decrease in use. A significant change in utilization is defined as a change of more than 25 percent. The map below displays the change in parking lot utilization across the MBTA network.

Why has parking use changed since the 2012–13 inventory?
- MBTA parking fees have changed at many parking lots between the 2012–13 and 2017–18 inventories. This includes a widespread adjustment to certain parking lots fees on September 2018, as a result of the MBTAs parking fare restructuring plan.
- Changes to the MBTA boarding fares have occurred between the 2012–13 and 2017–18 inventories. Changes to the boarding fares can have an effect on commuter behavior for those who typically park at certain MBTA stations. The commuter rail fare structure is organized by zones.
- The number of parking spaces at some parking lots changed between the 2012–13 and 2017–18 inventories. These changes may be temporary, such as when the parking lot is under construction or permanent, such as an opening or closure of a parking lot.
- Newly opened stations provided parking availability for several commuter rail and
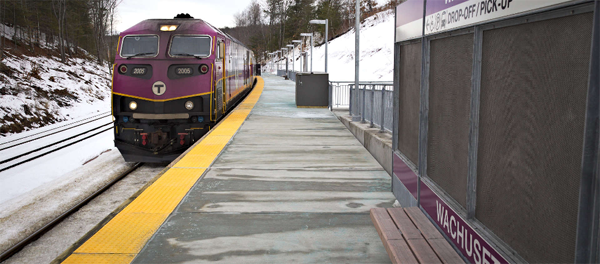
 rapid transit lines. Among the new stations that opened between the 2012–13 and 2017–18 inventories were Wachusett (351 spaces) along the Fitchburg Line and Assembly (350 spaces) along the Orange Line.
 - Ridesharing, like Uber and Lyft, and bike share programs, like Blue Bikes and Lime, were implemented between the two inventories potentially helping to solve the dilemma of the first- and last-mile stretch of a commute. Using data collected by Lime dockless bike trips in 2018 and 2019, MAPC discovered that, “15% of trips began or ended within 100 meters of a subway, trolley, Silver Line or Commuter Rail station.”
Learn more with the MPO Park-and-Ride Dashboard!
The MPO’s Park-and-Ride dashboard shows detailed parking information collected in the parking inventory, including the location of each parking lot near MBTA stations with details about vehicle parking space, bicycle parking information, and station amenities.

To dive deeper into the details, read the 2017–18 Inventory of Park-and Ride Lots at MBTA Facilities memorandum. The memorandum includes each completed park-and-ride inventory and analysis of parking use from a regional level. Additional information about station accessibility, station amenities, and permit-only parking are detailed in the memorandum.
MPO staff hopes to further this work by creating an online dashboard that will show commuter patterns to MBTA stations by traffic analysis zone (or TAZ). There are also plans to process archived park-and-ride data, which dates back to the year 2000. When processed, these data could be added to the Park-and-Ride dashboard.
In the future, the MPO is looking to see how the pandemic and the resulting likelihood of increased work from home might change parking use at MBTA stations. The MBTA is also working on transforming the commuter rail into a regional rail with less emphasis on traditional peak time travel and more focus on providing equal service throughout the day. Watch the MPO’s March 19th Pilot Transit Working Group meeting recording to hear more about this effort.
To learn more about the MPO’s work, visit Boston Region MPO’s Congestion Management Process (CMP) page. To stay informed about upcoming presentations and discussions related to the park-and-ride inventory, subscribe to the mailing list and follow @BostonRegionMPO on Twitter, Facebook, and Instagram. If you are interested in learning more about the MPO’s CMP, contact Ryan Hicks, CMP Manager, at rhicks@ctps.org.
The MPO is always looking for study ideas for the Unified Planning Working Program (UPWP). Submit your study ideas to Sandy Johnston, UPWP Manager, at sjohnston@ctps.org.
